
How to Look Up Davidson County Jail Population Data
Population data does not sit in one tidy dashboard. The most reliable county-specific numbers come from the Sheriff's facility pages and from federal PREA audit reports, which list designed capacity and population for each facility. The Sheriff's jail records and public records request page is the route to ask for figures that are not posted online.
National context comes from the Bureau of Justice Statistics. These figures update on their own schedules, so a capacity number from a 2024 audit is a snapshot, not a live count. The Sheriff's records request page explains how to ask for jail records.

For a single person rather than a count, the name search is the right tool, covered in the section near the end of this page.
Davidson County Jail Capacity Overview
The Sheriff runs more than one facility, each with its own designed capacity. The figures below are county-specific and come from official facility pages and PREA audits. They reflect different report dates, so they are not all from the same moment. The table lists each facility with its capacity and the population recorded at the time of the report.
| Facility / Source | Capacity | Population |
|---|---|---|
| Downtown Detention Center (2024 PREA) | 762 | 738; ADP 665 |
| Correctional and Detention Complex (2021 PREA) | 2,286 | 1,579 |
| DCSO Annex | 300 | Not published |
| Behavioral Care Center | 60 | Treatment beds, not jail |
Average Daily Population
Average daily population, or ADP, smooths out the day-to-day swings in a jail count. The 2024 PREA audit for the Downtown Detention Center listed an ADP of 665 over the prior 12 months, against a designed capacity of 762 and a current population of 738. The audit reported no overcapacity in that 12-month window. The comparison below shows those three figures side by side for the main jail.
| Measure | Downtown Detention Center |
|---|---|
| Designed capacity | 762 |
| Current population (at audit) | 738 |
| Average daily population (12 months) | 665 |
Note: ADP is a 12-month average and will not match the live count you see on the inmate roster on any given day.
Facility Transition Since 2020
The population picture shifted sharply around 2020. The Sheriff's materials describe a major facility transition that year. The Downtown Detention Center began housing inmates on April 22, 2020. The Hill Detention Center closed in May 2020. Maximum Correctional Center inmates moved to the new downtown jail, and female inmates moved to a reopened facility. The Metro Detention Facility was transferred from CoreCivic oversight to the Sheriff in October 2020, and most of that building closed by December.
By the 2024 audit, the downtown jail had settled into the capacity and population figures shown above. That transition is the reason older complex-wide numbers and current facility numbers do not line up neatly.
Behavioral Care Center Diversion
Not every count belongs in the jail total. The Behavioral Care Center is a 60-bed treatment facility, with 30 male and 30 female beds, used as a jail alternative. It is a state licensed adult supportive treatment facility, not a traditional jail. It provides short-term residential care for qualifying people with mental health or substance use needs. At full capacity, it is expected to serve an estimated 1,500 to 2,000 people a year.
Because it diverts people from jail, the center affects the broader population picture even though its beds are not jail beds.
Annex Capacity
The DCSO Annex on Harding Place adds 300 beds for a minimum and medium population. Its official facility page lists the capacity but does not publish a separate daily population figure. The Annex was repurposed during the 2020 transition and now holds part of the system's population. It also lists the providers used for phone, video visits, and commissary.
Pretrial vs Sentenced Population
A jail count is not one group. It mixes people held before trial with people serving short sentences. The pretrial group has not been convicted and is often held on bond. The sentenced group is serving time, usually for misdemeanors or shorter terms, since long felony sentences move to state prison. The split matters, because diversion and bond reform affect the two groups in different ways.
A current pretrial-versus-sentenced ratio for Davidson County was not published in the official pages used for this research. Treat that as an open figure to request from the Sheriff rather than a number to estimate.
Population Trends Over Time
The available official records show a big shift around 2020 followed by stabilization at the main jail. After the facility transition, the Downtown Detention Center settled into a designed capacity of 762 with an average daily population near 665. The 2024 audit reported no overcapacity in the prior year. A longer year-by-year trend line was not posted in the official sources, so the safest read is the audit snapshots rather than a smooth multi-year curve.
County Population Context
Jail numbers make more sense against the size of the county. The U.S. Census QuickFacts estimate for Davidson County is 729,505 as of July 1, 2024, up from 715,884 at the 2020 Census. The land area is 503.70 square miles, with a 2020 density of about 1,421 people per square mile. This is a large, dense urban county, which helps explain the volume that moves through General Sessions and the Criminal Court.
The Census QuickFacts page is the source for these county figures.
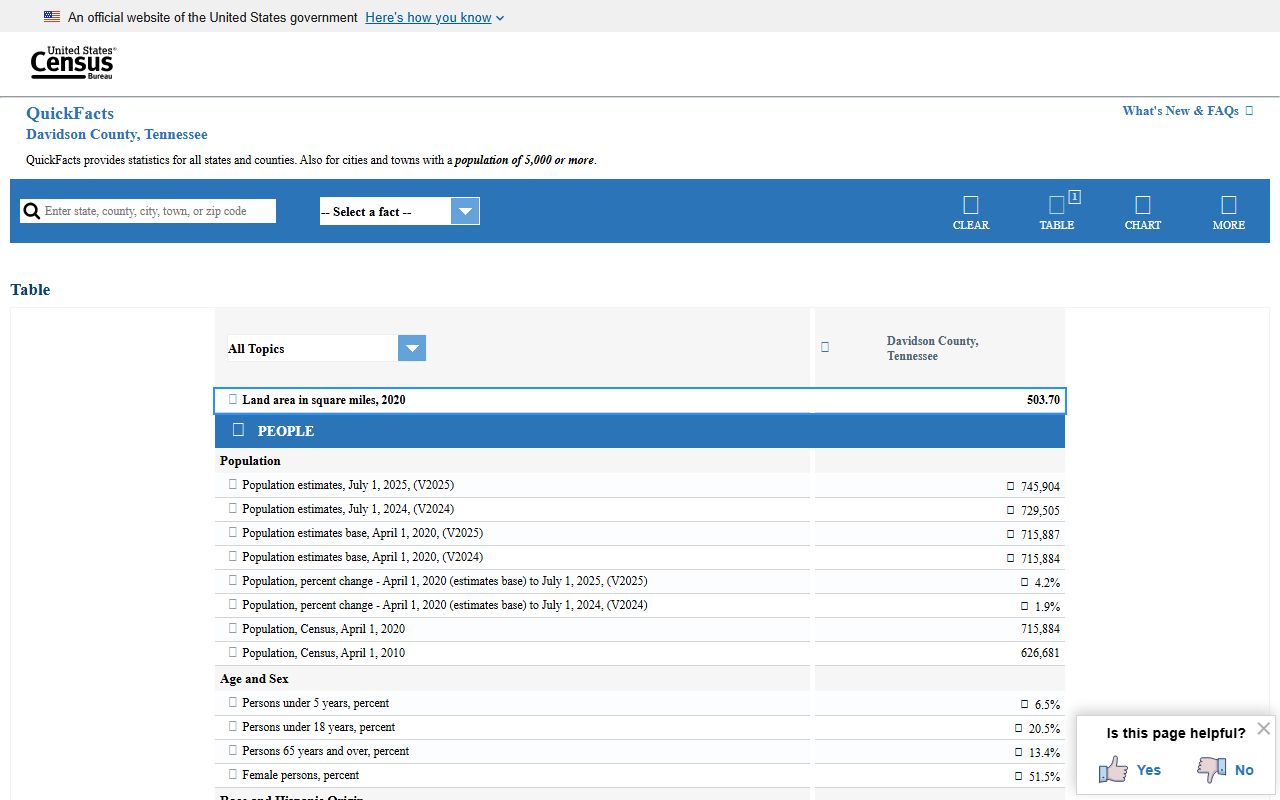
The county is about 51.5 percent female, 25.9 percent Black, and 14.4 percent Hispanic or Latino, with 14.8 percent foreign-born residents. These are county figures, not jail figures.
National and State Context
National jail data is tracked by the Bureau of Justice Statistics, which publishes counts and rates across the country. That national context is useful for comparison, but it should not be confused with a Davidson County figure. The county-specific numbers come from the Sheriff and PREA audits. National and state averages come from separate federal and research sources.
Keeping those apart matters. A national jail rate per 100,000 residents is not the same as the Davidson County count, and the two should never be merged into one number.
Data Gaps and What to Verify
Some population details are not published in the official pages used for this research. A facility-by-facility demographic breakdown by race, sex, and age was not located. A current pretrial-versus-sentenced ratio and annual bookings by year were also not posted. Those gaps are real, and inventing numbers to fill them would be worse than leaving them open.
For figures not shown here, the Sheriff's public records process is the right channel. Ask for the specific report and date you need.
Programs That Affect the Population
Programs change the count, not just the conditions. Work release and Day Reporting let some people serve part of a sentence in the community, which lowers the in-house population. New Avenues treatment and the Behavioral Care Center divert others from a jail bed entirely. These programs are part of why the average daily population sits below the designed capacity at the main jail.
Searching for Davidson County Inmate Records by Name
This page is about counts, not individuals. To find one person in custody, the population data will not help. Use the Sheriff's active inmate search instead, which is covered in full on the Davidson County inmate records page. That tool searches by name, date of birth, and other fields.
Where the Data Comes From
The county figures here come from the Sheriff's official facility pages and federal PREA audit reports for the Downtown Detention Center and the older complex. County demographic and size figures come from the U.S. Census QuickFacts. National context comes from the Bureau of Justice Statistics. Each source updates on its own schedule, so always check the report date before treating a number as current.